
Plotting Manager Elo Ratings by Club Part 1
Prior to managing Manchester United, José Mourinho had won the league in the second season with every club prior. The 2016-17 season saw Mourinho’s United finish 6th in the league (United did however win the UEFA Europa league). Many expected José would do what he’s always done in his second seasons with every club: adapt, dominate, become champions. Despite improving his side, United finished runners up to Pep Guardiola’s unstoppable Manchester City. José undoubtedly improves his squads in two seasons however after that second season his sides taper off. John Burn Murdoch shared a great article and data viz on twitter:
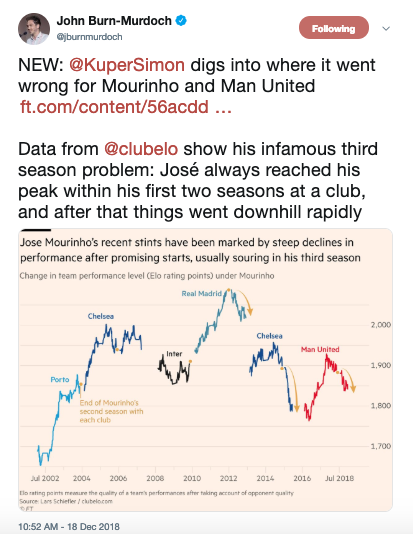
I found this absolutely fascinating. Great article in the Financial Times and such a clean data viz. I’ve spent a decent amount of time on ClubElo.com and yet I’ve never taken advantage of the public API. John generously shared the script he used for the graph, available here, and I wanted to write a function that could be generalized to see the Elo history of any manager.
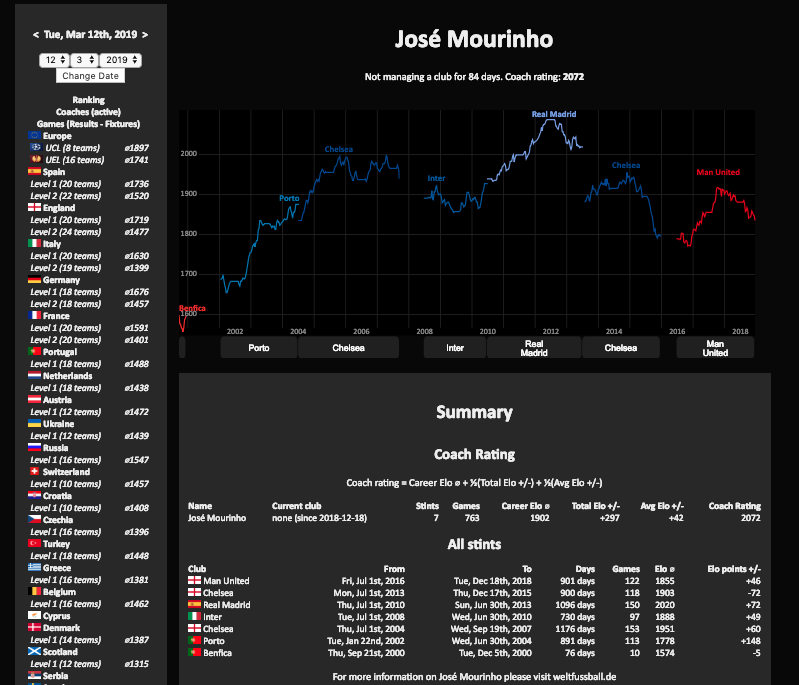
The script was written specifically to Jose Mourinho’s club history. There isn’t an API call that extracts the Elo history for managers. So to recreate a graph like that below, it will take a little more work. Here is José Mourinho’s page on ClubElo.
ClubElo
ClubElo.com is built and maintained by Lars Schiefler. If you are a football fan and are unfamiliar with ClubElo.com I highly recommend you visit the site.
What is Elo?
Elo is a common method used to rate and rank professional teams. FiveThirtyEight has a few different Elo rankings for the NBA, MLB, and NFL - Club Soccer uses Soccer Power Index, or SPI, but it uses similar methodology, however SPI only takes on values between 0 and 100.
For reference, here is a brief description of ClubElo’s:
The Elo system with a few modifications (home field advantage, goal difference, inter-league adjustments) is used to determine the club’s Elo values. The match odds are based on a result histogram for the two club’s Elo difference.
The API
ClubElo documentation can be found here. API calls include: one full day Elo ranking, one club full Elo history, upcoming fixtures. Notice there is no API call for manager Elo history. Just means we’ll have to be creative!
Methodology
We will build off John’s script and make a few tweaks of our own. Let’s first consider the steps John used:
- Identify manager (Jose Mourinho)
- Read data for each club managed (Porto, Chelsea, etc.)
- Filter each club’s Elo to manager’s era
- Combine all clubs into one data frame
- Select highest Elo by club for label
- Plot data
Recall, our goal is to write a generic function that will plot any manager’s Elo history. What do we need to do this?
Our function should take an argument, manager, similar to that on ClubElo. Next, we need to know managerial history. Even though there isn’t an API for managerial history, managers have their own pages on ClubElo (here is Jose Mourinho’s). I’ve had some experience web scraping, to which I can probably access the manager’s managerial history. Hopefully the managerial history will include the dates of employment, which we can use to filter each club. Once we filter club Elo history and combine all the club history together we can follow John’s script to plot the data.
Recreate the script
First, let’s try to recreate the graph for another manager, this time without manually entering the start and end dates that they managed their club.
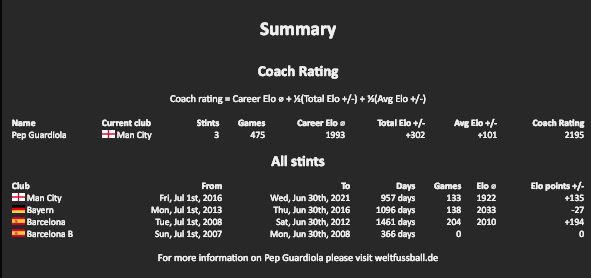
Let’s look at Pep Guardiola - arguably the best manager in world football. If we look at his Club Elo history we see that there is a table with his managerial history.
Let’s start by getting this information into R using rvest.
# Load our packages
library(rvest)
library(tidyverse)
library(lubridate)

# Download html file of Pep's ClubElo page
download.file(url = "http://clubelo.com/PepGuardiola",
              dest = "pep.html")

# Read html file
pep_raw <- read_html("pep.html") %>%
  html_table(header = TRUE,
             fill = TRUE)
pep_raw contains more data than we need. It’s actually a list containing all data on Pep’s webpage. Let’s extract the data we want: managerial history.
# Extract third element in list
pep_club_history <- pep_raw[3][[1]]
pep_club_history
#         Club               From                  To      Days Games Elo ⌀ Elo points +/-
#1    Man City Fri, Jul 1st, 2016 Wed, Jun 30th, 2021  957 days   133  1922            135
#2      Bayern Mon, Jul 1st, 2013 Thu, Jun 30th, 2016 1096 days   138  2033            -27
#3   Barcelona Tue, Jul 1st, 2008 Sat, Jun 30th, 2012 1461 days   204  2010            194
#4 Barcelona B Sun, Jul 1st, 2007 Mon, Jun 30th, 2008  366 days     0    NA              0
Pep has had three major stints working in club football: Barcelona, Bayern Munich, Manchester City. We are working toward plotting all three of these clubs on one graph, but let’s first create a generalized procedure to extract a club’s Elo. First we will look at Man City’s Elo with Pep.
# Define table row
row <- 1

# Extract club name
city_string <- pep_club_history[row, 1] %>%
  str_remove(pattern = " ")

base_api <- "http://api.clubelo.com/"

# Paste base url and club name together
city <- str_c(base_api, city_string)

city_elo <- read_csv(city)

city_elo
## A tibble: 5,723 x 7
#   Rank  Club     Country Level   Elo From       To
#   <chr> <chr>    <chr>   <int> <dbl> <date>     <date>
# 1 None  Man City ENG         2 1365. 1946-07-07 1946-09-04
# 2 None  Man City ENG         2 1372. 1946-09-05 1946-09-07
# 3 None  Man City ENG         2 1370. 1946-09-08 1946-09-14
# 4 None  Man City ENG         2 1384. 1946-09-15 1946-09-18
# 5 None  Man City ENG         2 1386. 1946-09-19 1946-09-21
# 6 None  Man City ENG         2 1398. 1946-09-22 1946-09-28
# 7 None  Man City ENG         2 1400. 1946-09-29 1946-09-29
# 8 None  Man City ENG         2 1417. 1946-09-30 1946-10-03
# 9 None  Man City ENG         2 1423. 1946-10-04 1946-10-05
#10 None  Man City ENG         2 1417. 1946-10-06 1946-10-12
## … with 5,713 more rows
We just read in the entire Elo history for Man City. We need to filter to Elo since Pep has been manager. We’ll refer back to pep_club_history and use his dates of employment. Note: Pep’s contract with City ends in 2021, so we’ll only look at his Elo to today.
pep_start <- pep_club_history[row, 2] %>%
  as_date(format = "%a, %b %dst, %Y", tz = "")

pep_end <- pep_club_history[row, 3] %>%
  as_date(format = "%a, %b %dth, %Y", tz = "")
# Set end elo to today
pep_end <- if_else(pep_end > Sys.Date(), Sys.Date(), pep_end)

# Pep Era: City's Elo
pep_city_elo <- city_elo %>%
  filter(From >= pep_start & To <= pep_end)
Let’s identify City’s highest Elo under Pep - we will use this to label our graph.
pep_label <- pep_city_elo %>%
  top_n(1, Elo)
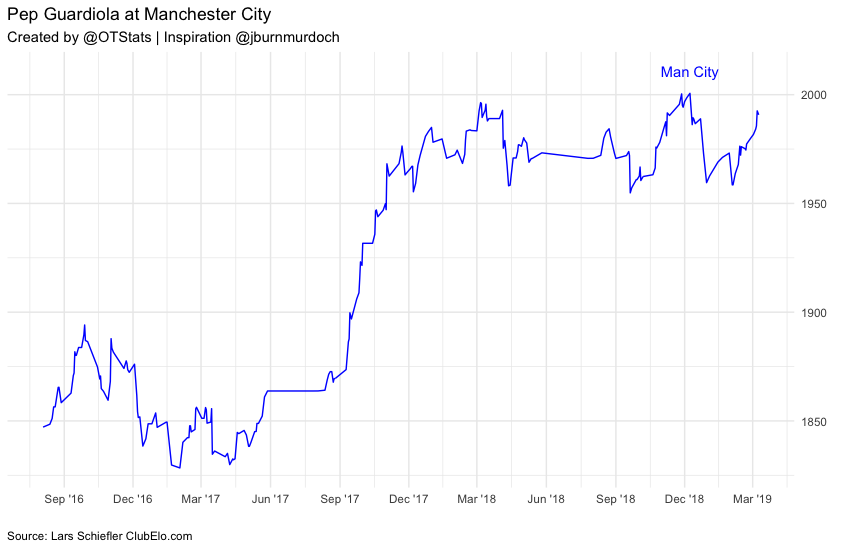
Let’s plot our data:
pep_city_elo %>%
  ggplot(aes(x = To, y = Elo)) +
  theme_minimal() +
  geom_line(color = "blue") +
  geom_text(data = pep_label, aes(y = Elo + 10, label = Club), color = "blue") +
  scale_color_discrete(guide = F) +
  scale_y_continuous(position = "right") +
  scale_x_date(date_breaks = "3 months", date_labels = "%b '%y") +
  labs(title = "Pep Guardiola at Manchester City",
       subtitle = "Created by @OTStats | Inspiration @jburnmurdoch",
       x = "",
       y = "",
       caption = "Source: Lars Schiefler ClubElo.com") +
  theme(plot.caption = element_text(hjust = 0))
That’s it for Part I! Check back soon for Part II!