
MLS 2022 xG Comet plot
The MLS 2022 is nearing its end. There are some clear front runners going into the playoffs, but I’ve started to wonder how teams offensive and defensive tendencies have shifted during the season. I’ve seen comet plots make the rounds on Twitter and wanted to try my hand at it.
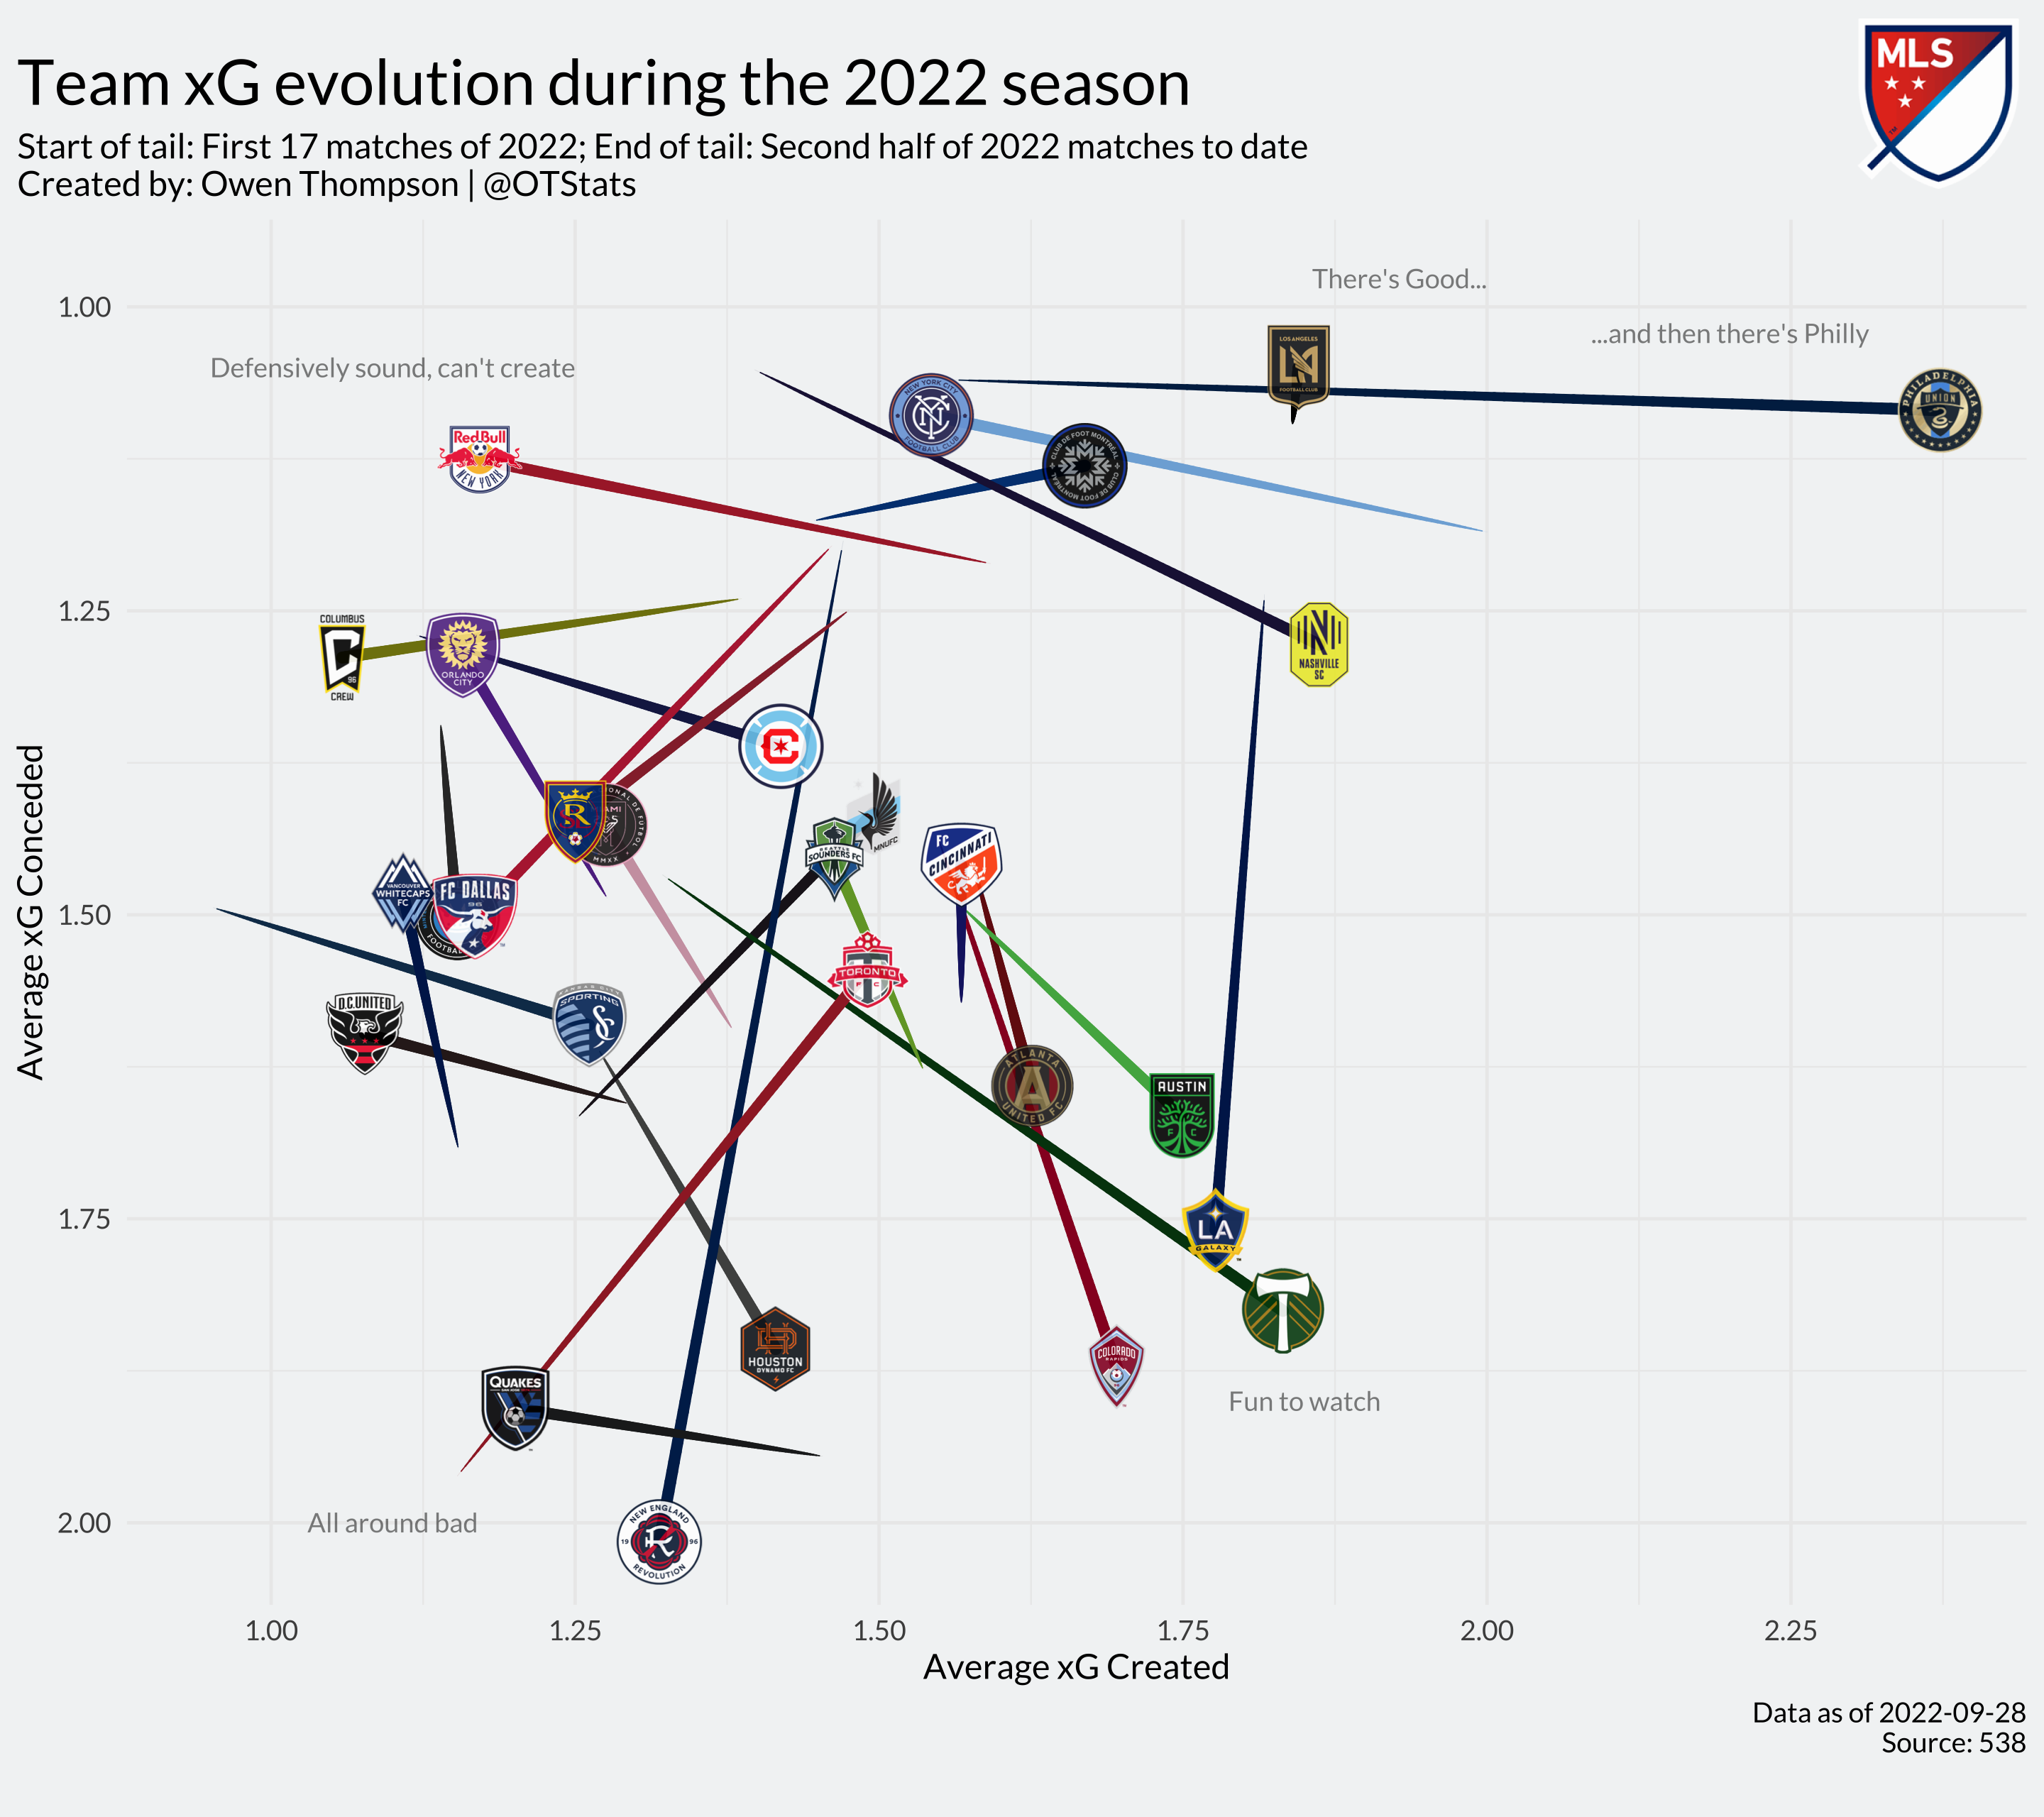
As for the results, I’m incredibly surpirsed that so many teams have made so many drastic shifts (some for the better and many for the worst). My local club Nashville SC are creating almost 0.5 of a goal scoring opportunity per match, compared to the first half of the season. Teams like the LA Galaxy and the New England Revolution are conceding a lot more opportunities later this season. Meanwhile in New York, the Red Bulls and NYCFC can’t seem to create as many opportunities as they were in the beginning of the season. The Philadelphia Union, however, have dramatically inmproved on their already impressive offensive prowess.
On the programming side of things, I had fun building this plot and playing with some new packages.
I used the {ggpath} package to create the comet trails, and discovered that {ggpath} is the best package for rendering images as points in my plots (previously I was using geom_image, and I had a lot of issues with distorted images).
You can reference my source code for this plot here — I’m happy to answer any questions about my process or code. Thanks for reading!