
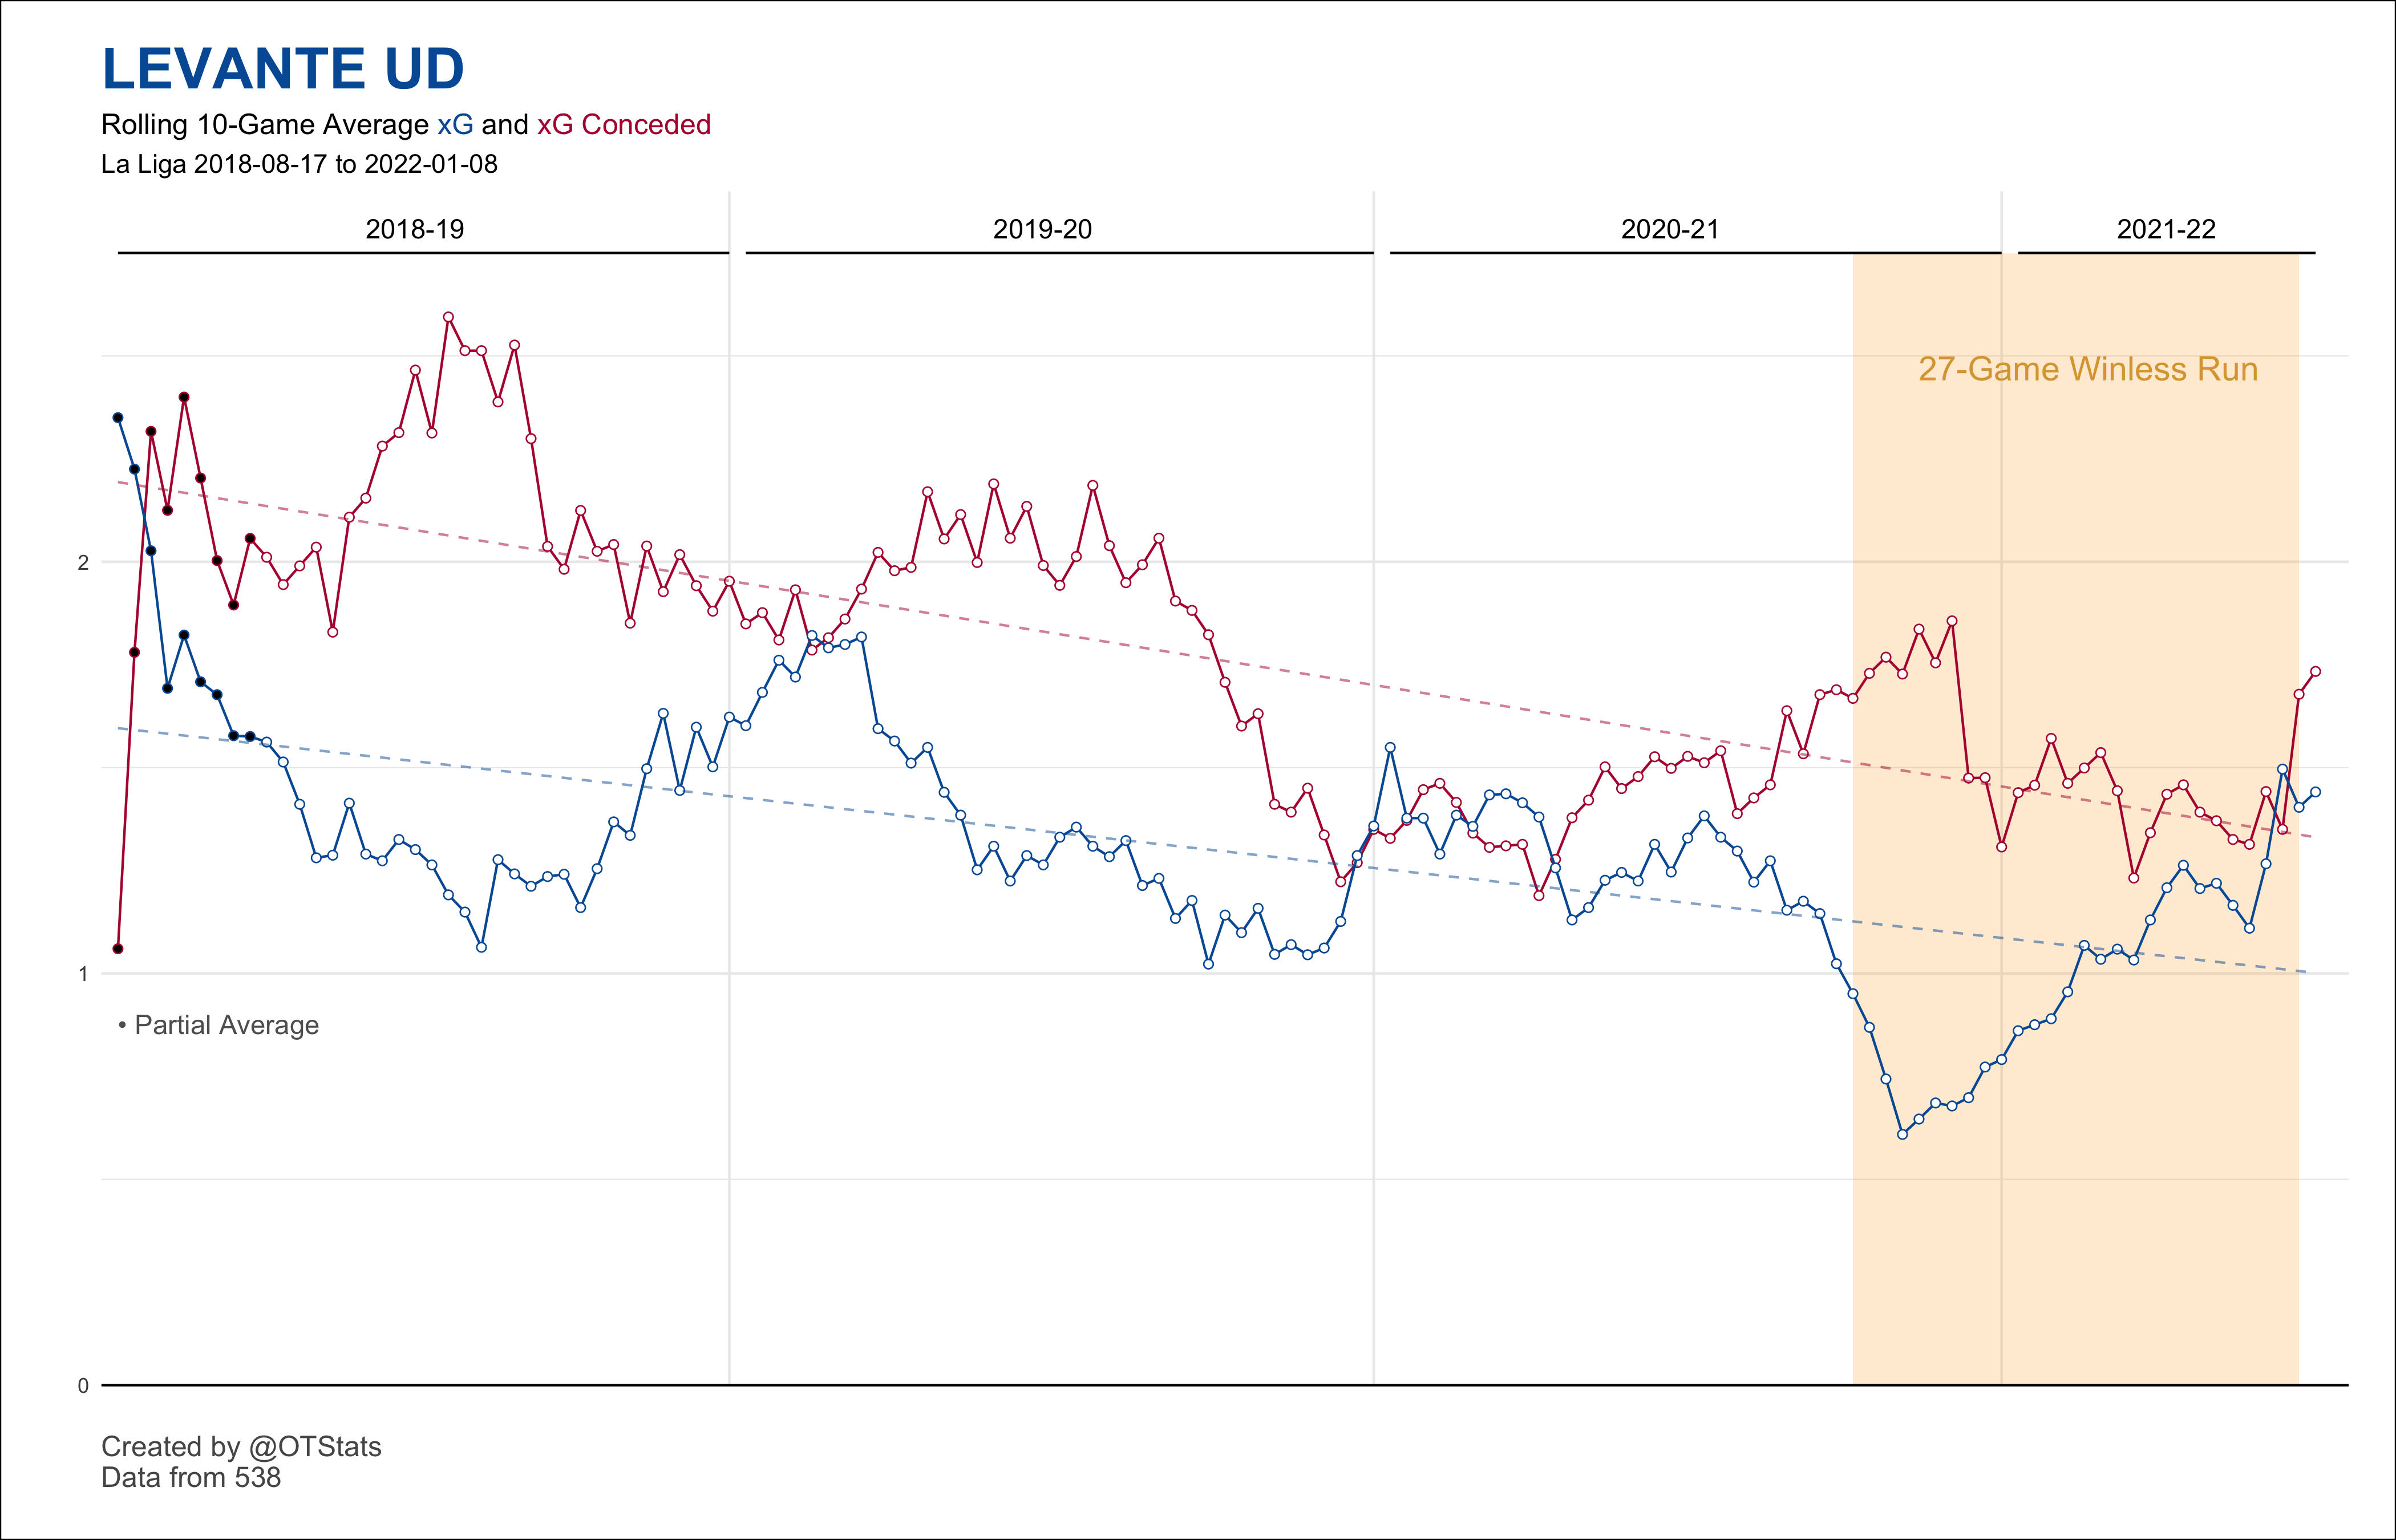
Levante’s Winless Streak
While living in Valencia I fell in love with their local footbal clubs. At the time Levante were playing in Spain’s second division, going on to eventually win the league and were promoted to La Liga. They’ve since remained in La Liga and have experienced a really tough recent stretch of results.
2 weeks ago, Levante finally snapped their 27-game winless run. They’ve always been a fun, high-octane team to watch, typically going toe-to-toe with their opponents. I’ve always felt like they create and concede a ton of chances, so I was curious how this has evolved during their winless run.
Surprisingly, this is my first time creating a rolling xG plot. It took a little time to play around with differentiating the partial average and a few other aesthetics. I wish I had the time to set up rules so that the aesthetics, such as the season year annotations, wouldn’t be hardcoded, but it is what it is. I had a pretty good idea early on how to produce the plot I wanted, but if you want a tutorial reference Caleb Shreve’s excellent article here.
You can reference my source code for this plot here — I’m happy to answer any questions about my process or code. Thanks for reading!