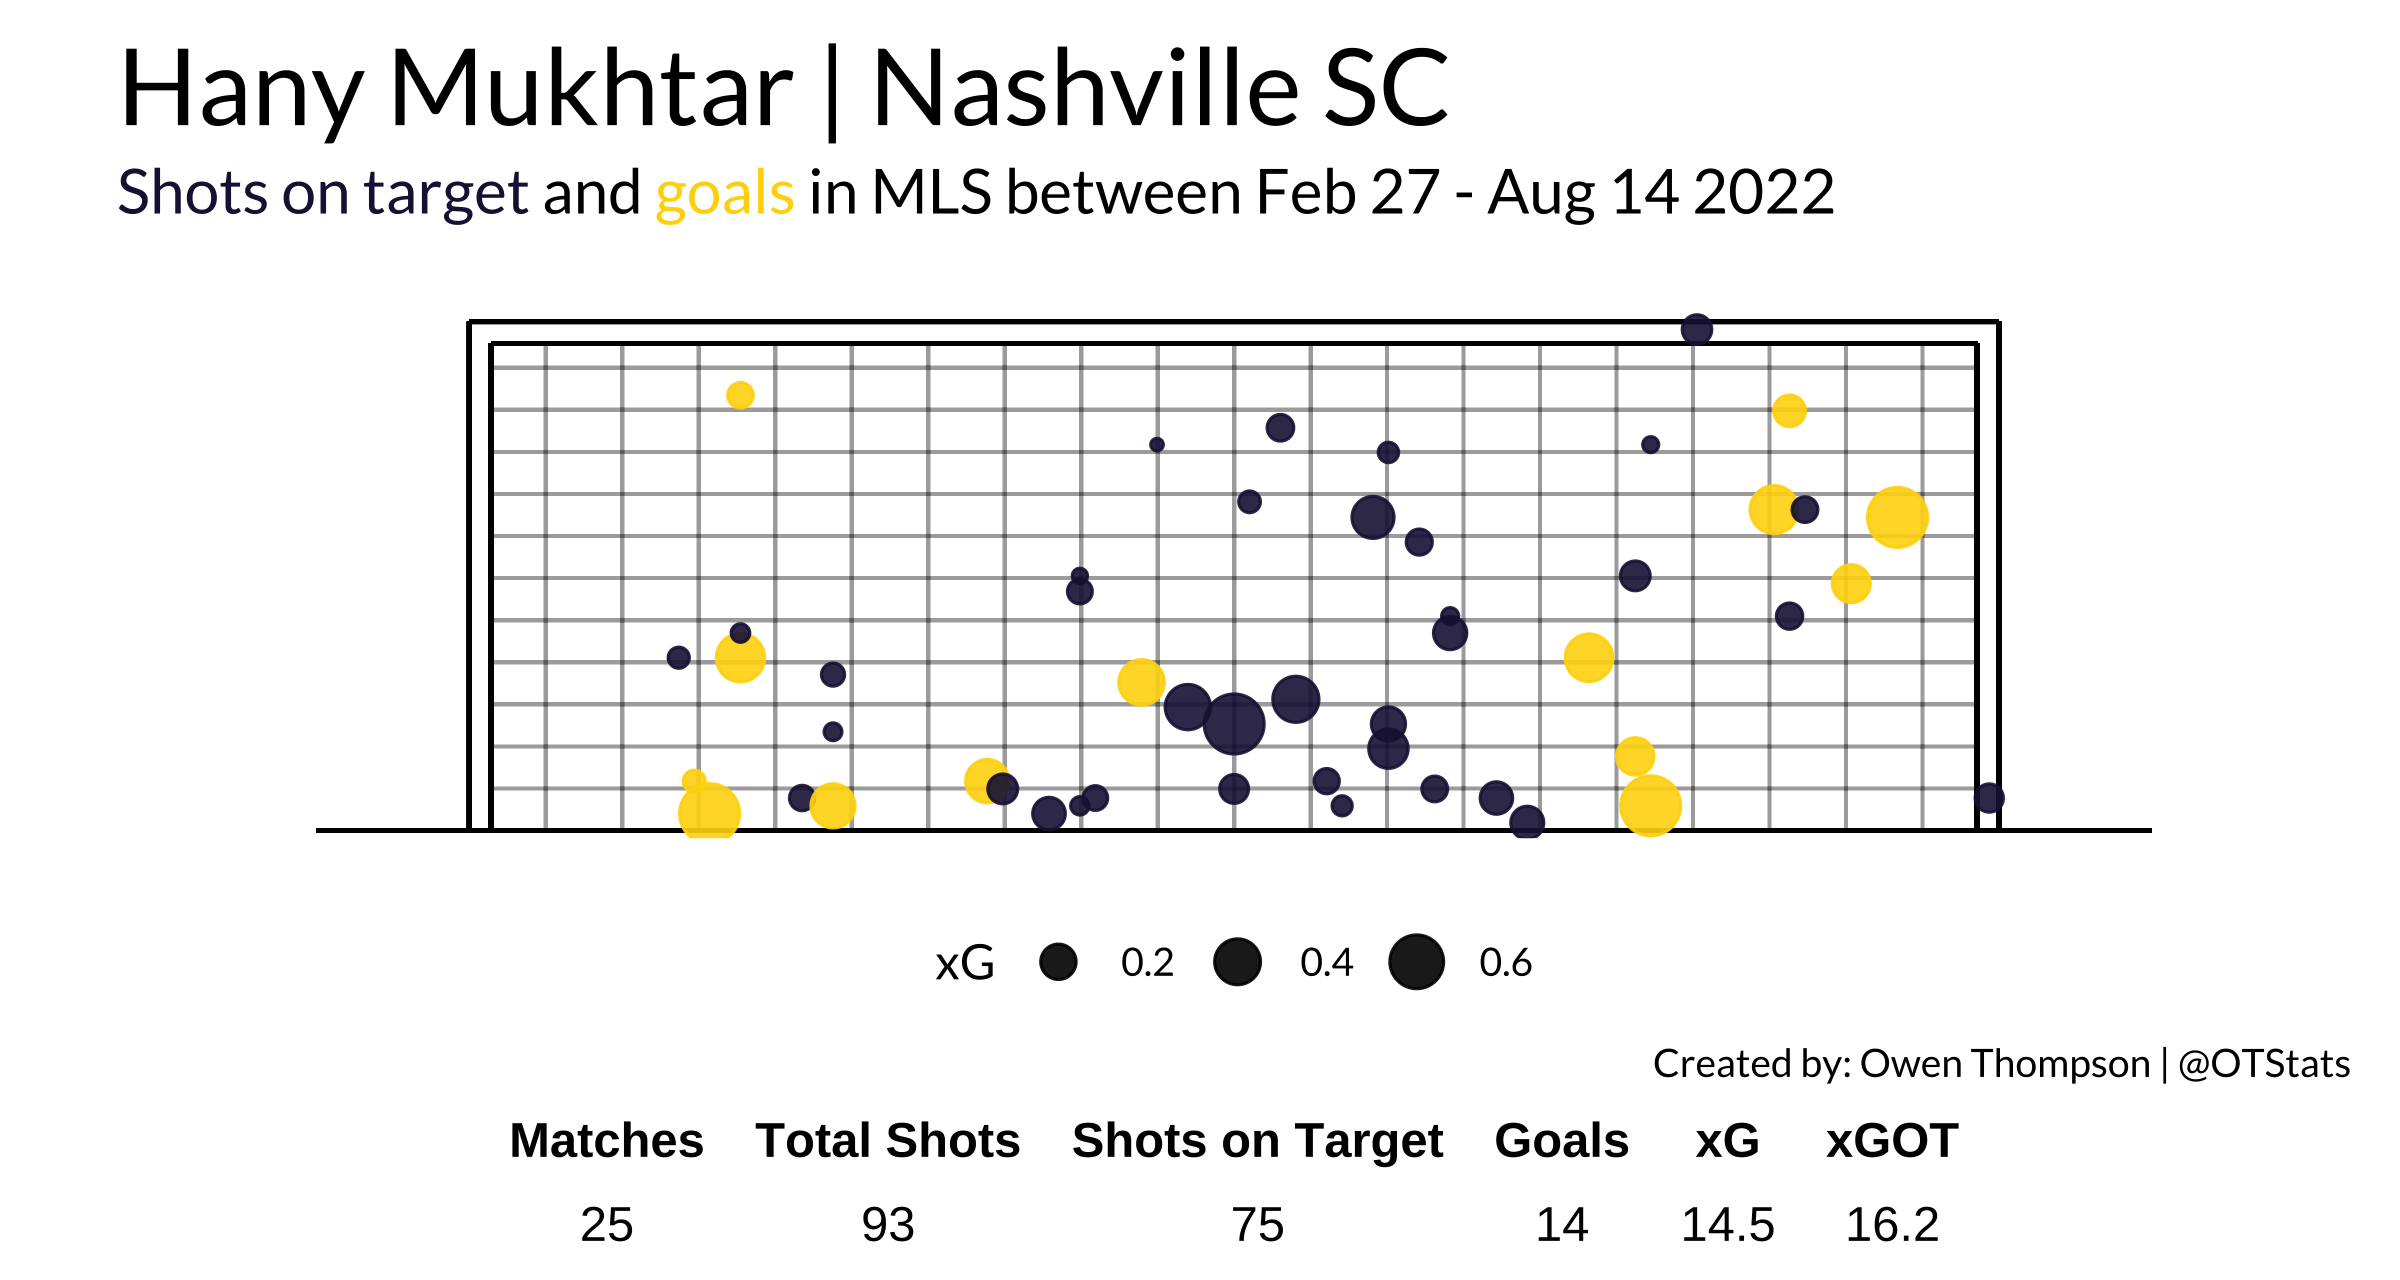
Hany Mukhtar’s 2022 Shots on Target
Hany Mukhtar is well on his way to an MLS MVP candidacy this season, so I wanted to take a look at Hany’s goal finishing ability. I’ve recently gotten a lot of practice with the {worldfootbalR} package, which is an incredible useful packages that provides a wrapper for extracting data from football data providers like FotMob.

Interesting… to date, all of Hany’s goals have been scored inside the penalty area.
I’m generally pretty proud of the result. I spent a decent chunk of time trying to find a R package that would produce a table that could be inset into my ggplot object, but struggled to find one where I could also customize (e.g. font face).
You can reference my source code for this plot here — I’m happy to answer any questions about my process or code. Thanks for reading!
